¶ When Requests is not enough
The Requests page shows calls that became a Request, and what went over the wire. Some failures never get that far: a wrong endpoint code, a mapping that fails before the HTTP call, a missing environment variable. The engine still writes every step to its logs, and on staging those logs are searchable in Kibana. In this lesson we break the reference endpoint VICTOR_KEZA_ELIGIBILITY_FETCH on purpose, five different ways, and find each fault in the logs.
Where each kind of evidence lives
| Requests page | Kibana | |
|---|---|---|
| Unknown endpoint code | Nothing (no Request is created) | The lookup and ENDPOINT_NOT_FOUND_EXCEPTION |
| Mapping or environment-variable error | A Request, no partner call | The exact exception, e.g. MISSING_ENVIRONMENT_VARIABLE in transformPayload |
| What the mapping produced | The outgoing call in the Communication Trace | Transformed request for endpoint …, with secrets masked |
| Login (token) calls | Not listed (the Communication Trace shows only partner calls) | Sending HTTP request to …/auth/login and its answer |
| When a mapping was really changed | No | Upserting mapping for endpoint … |
¶ Get access
Kibana (staging): kibana.staging.iremboinc.com/app/discover. If you cannot log in, request Kibana access on the Irembo service desk (the same form as for the portal). Never share a Kibana login in a chat or a ticket.
¶ Find one call in five steps
Keep the curl output of the call you are debugging open.
¶ Step · 1 · Open Discover
Pick the data view irembo (top left). It holds the logs of every Irembo application.
¶ Step · 2 · Set a narrow time range
A few minutes around the call. Kibana shows times in your browser’s time zone (Kigali = UTC+2); the logs themselves are stored in UTC.
¶ Step · 3 · Search
Type a KQL query (below): by endpoint code, or by the Request id (data.id in a success response, or the id shown in Requests). Error responses carry no traceId, so these two are your handles.
¶ Step · 4 · Take the traceId
Every engine line of one sync call shares a traceId (gateway and mock lines and automatic retries do not: see Surrounding documents below). Add the traceId, level and message columns, then filter on traceId:"…" and sort by time, oldest first.
¶ Step · 5 · Read top to bottom
Find the last normal line and the first error. The fault is between them.
KQL cheat sheet (paste into the Discover search bar)
# all fetch calls to one endpoint (the New Relic line carries the URL)
service:"integration-mgmt-engine" and message:"integration/v1/fetch/sync/VICTOR_KEZA_ELIGIBILITY_FETCH"

# push calls
service:"integration-mgmt-engine" and message:"integration/v1/push/sync/VICTOR_KEZA_ENROLLMENT_PUSH"

# one call from its Request id
message:"a5259acb-4dbb-46e9-8fd3-65d24a0c62b4"

# every line of one call, keeping only the useful ones
traceId:"6aba5e1c3bfaaec80a3d76427ff7a9ac" and (message:"Transformed request" or message:"Sending HTTP request" or message:"Got HTTP response" or message:"Exception")

# automatic retries of a failed push (they run under a new traceId each time)
service:"integration-mgmt-engine" and thread:"scheduling-1" and message:"<Request id>"

# errors only, for one endpoint code, while you reproduce
service:"integration-mgmt-engine" and level:"ERROR" and message:"VICTOR_KEZA_ELIGIBILITY_FETCH"
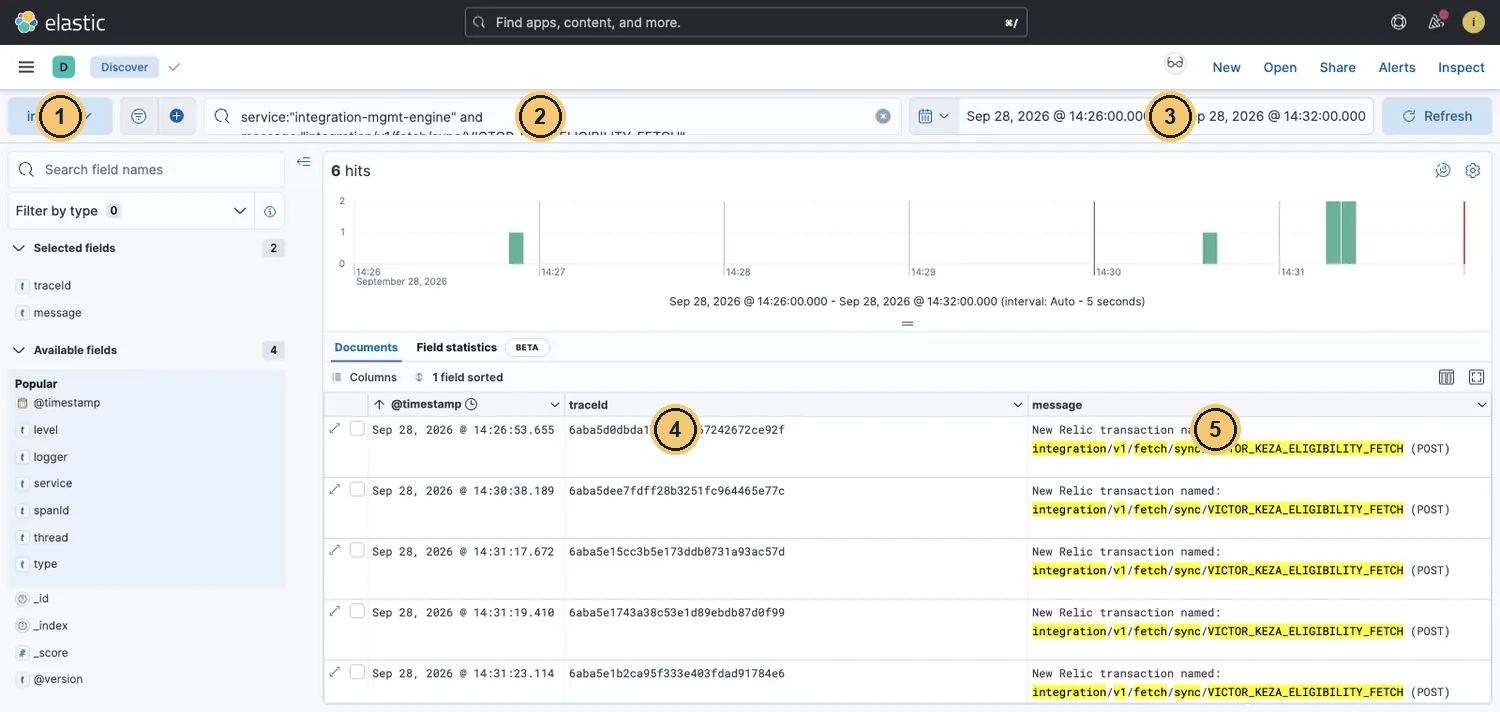
Kibana Discover: find the calls to one endpoint by its URL in the New Relic line
- Data view irembo (all Irembo application logs).
- KQL:
service:"integration-mgmt-engine" and message:"integration/v1/fetch/sync/VICTOR_KEZA_ELIGIBILITY_FETCH" - Time range: keep it narrow (minutes around the call). Times are shown in your browser’s time zone.
- traceId: one per call. Copy it to see every engine line of that call.
- This line is logged at level ERROR by the monitoring agent even when the call succeeds: it is noise, use it only to find the call.
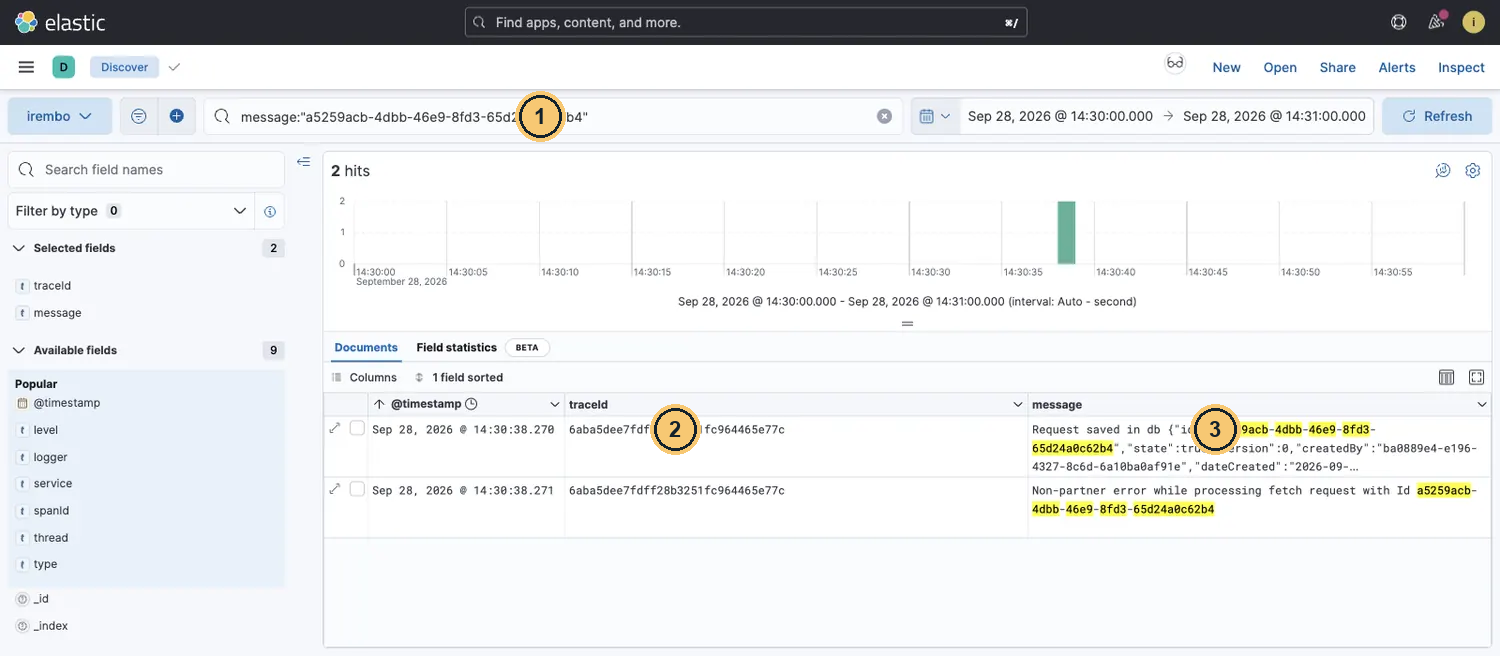
Find a call from its Request id (data.id in the response, or the id in Requests)
- KQL:
message:"a5259acb-4dbb-46e9-8fd3-65d24a0c62b4" - The traceId of that call. Filter on it next.
- Request saved in db: the Request row was created.
The lines of one call, in order
| Log line (message starts with…) | What it proves |
|---|---|
New Relic transaction named: integration/v1/fetch/sync/<CODE> |
The call reached the engine. Logged at level ERROR, but it is not an error |
Get an endpoint by code <CODE> |
The engine is looking up the endpoint |
Request saved in db {"id": …} |
The Request row exists (its id is the data.id / Requests id) |
Transformed request for endpoint <CODE>: {…} |
The request pass of the mapping succeeded; this is its output |
Caching not enabled / cache lines |
Whether the response cache was used |
Sending HTTP request to URL …, Method … |
The engine called this URL (login calls appear here too) |
Got HTTP response … |
The partner answered 2xx |
HttpClientErrorException … Message 404 Not Found: … |
The partner answered 4xx; the body follows |
Partner Exception: PARTNER_ERROR_FETCH-<CODE> |
The engine turned that into the 500 the caller saw |
Calling endpoint - time: 96 ms |
Partner round-trip time |
EXCEPTION_OCCURRED: className=…, methodName=… |
Where in the engine an exception was raised (a duplicate of the next line, with the location) |
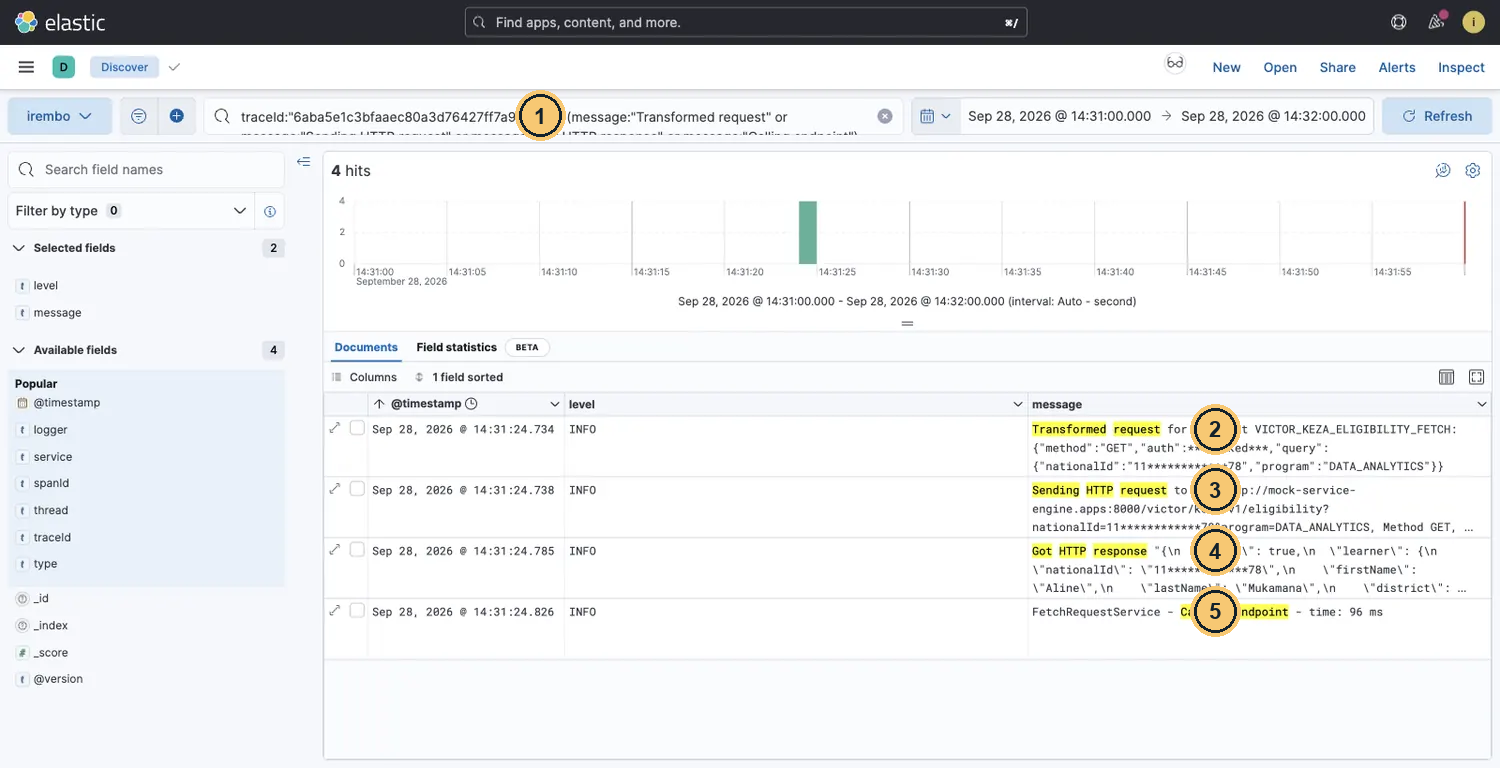
A healthy call, filtered by traceId: the four lines that tell the story
traceId:"…" and (message:"Transformed request" or …)- Transformed request: what your mapping produced. auth is masked, IDs partly masked.
- Sending HTTP request: the exact URL and method the engine called.
- Got HTTP response: the partner’s answer.
- Calling endpoint - time: partner round trip (96 ms).
Your tech notes · What Kibana hides, on purpose
The engine masks secrets before logging:
"auth":***masked***, token cache keys and passwords never appear, and National IDs are cut to11************78. So you cannot search by a National ID: search by endpoint code or Request id. Masking does not make logs public: screenshots of Kibana still go only into internal tickets, and only with synthetic test data like ours.
¶ Break it, then find it
Each scenario below was run on staging on 28 Sep 2026: we changed one thing in the mapping of VICTOR_KEZA_ELIGIBILITY_FETCH (with Edit, then Update), called it for Aline with the usual curl, then went to Kibana. After the last scenario the original mapping was restored and proven with a 200.
¶ Scenario 1 · a typo in the endpoint code
The caller sent VICTOR_KEZA_ELIGIBILTY_FETCH. The curl and its 404 are in Lesson 1.6. In Kibana, search message:"ELIGIBILTY".
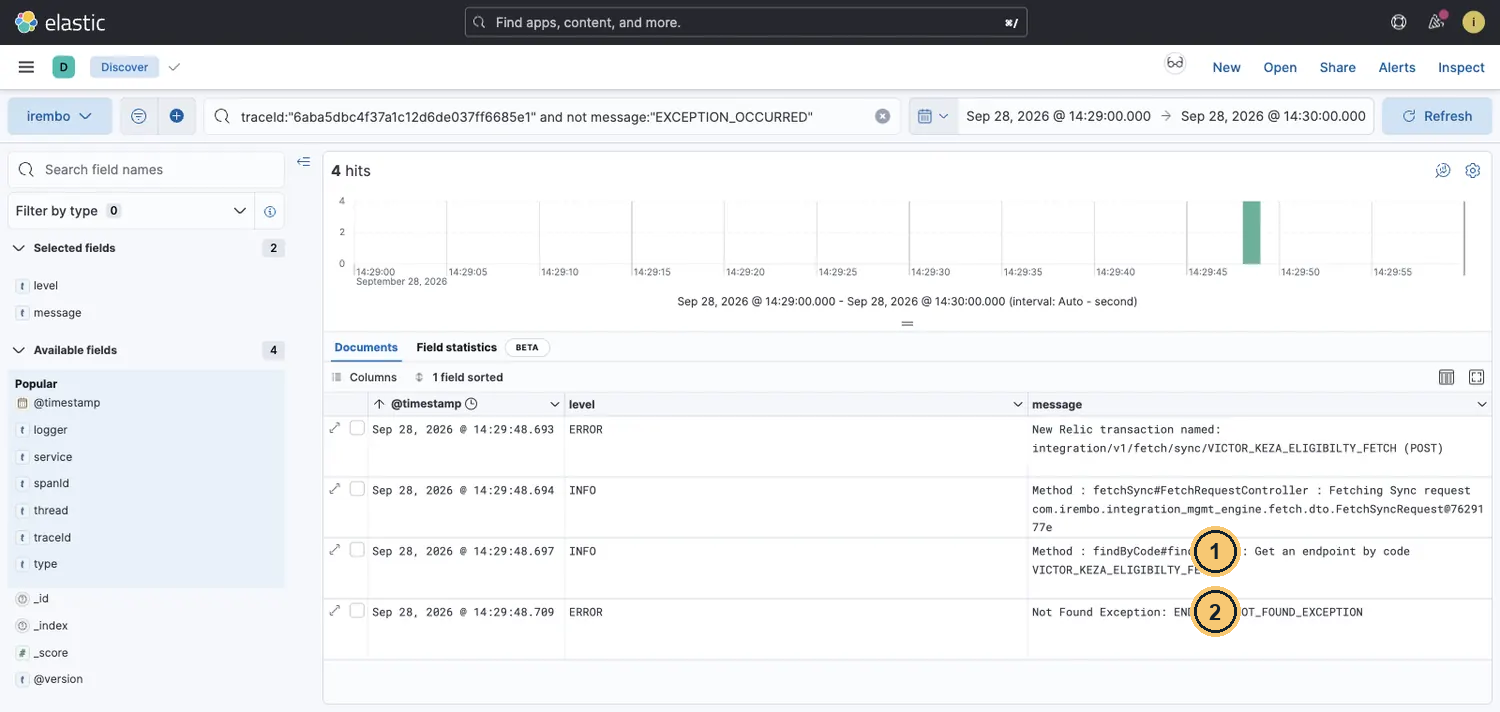
Scenario 1 · typo in the endpoint code: the trace stops at the lookup
- Get an endpoint by code VICTOR_KEZA_ELIGIBILTY_FETCH: read the code letter by letter (an I is missing).
- Not Found Exception: ENDPOINT_NOT_FOUND_EXCEPTION. No mapping, no HTTP call, no Request row.
¶ Scenario 2 · a missing environment variable
We replaced the training password with the proper configuration, "password": "${KEZA_PASSWORD}", but KEZA_PASSWORD is not defined on staging.
¶ Scenario 2 · the caller’s view · fetch/sync · VICTOR_KEZA_ELIGIBILITY_FETCH
HTTP 500 0.80 s captured on staging · 28 Sep 2026
1 · Request (curl)
curl -s -X POST "https://integration-gateway.staging.iremboinc.com/integration/v1/fetch/sync" \
  -H "Authorization: Bearer $TOKEN" \
  -H "portal: integration-management-portal" \
  -H "Content-Type: application/json" \
  -d '{
  "endpointCode": "VICTOR_KEZA_ELIGIBILITY_FETCH",
  "callerId": "victor-course",
  "requester": "victor-course",
  "payload": {
    "nationalId": "1199880012345678",
    "programCode": "DATA_ANALYTICS"
  }
}' | jq
2 · Real response
{
  "httpStatus": 500,
  "exception": "ServerErrorException",
  "responseCode": null,
  "responseMessage": "MISSING_ENVIRONMENT_VARIABLE",
  "fieldErrors": null
}
3 · What to notice
- 500,
responseCode null, messageMISSING_ENVIRONMENT_VARIABLE. The response does not say which variable. - The format was right (whole string, quotes included). A wrong format would not fail here:
"Bearer ${X}"or"$X"are sent to the partner as plain text, and the partner answers 401. - It fails even while a token is cached: the mapping is evaluated before the token cache is read.
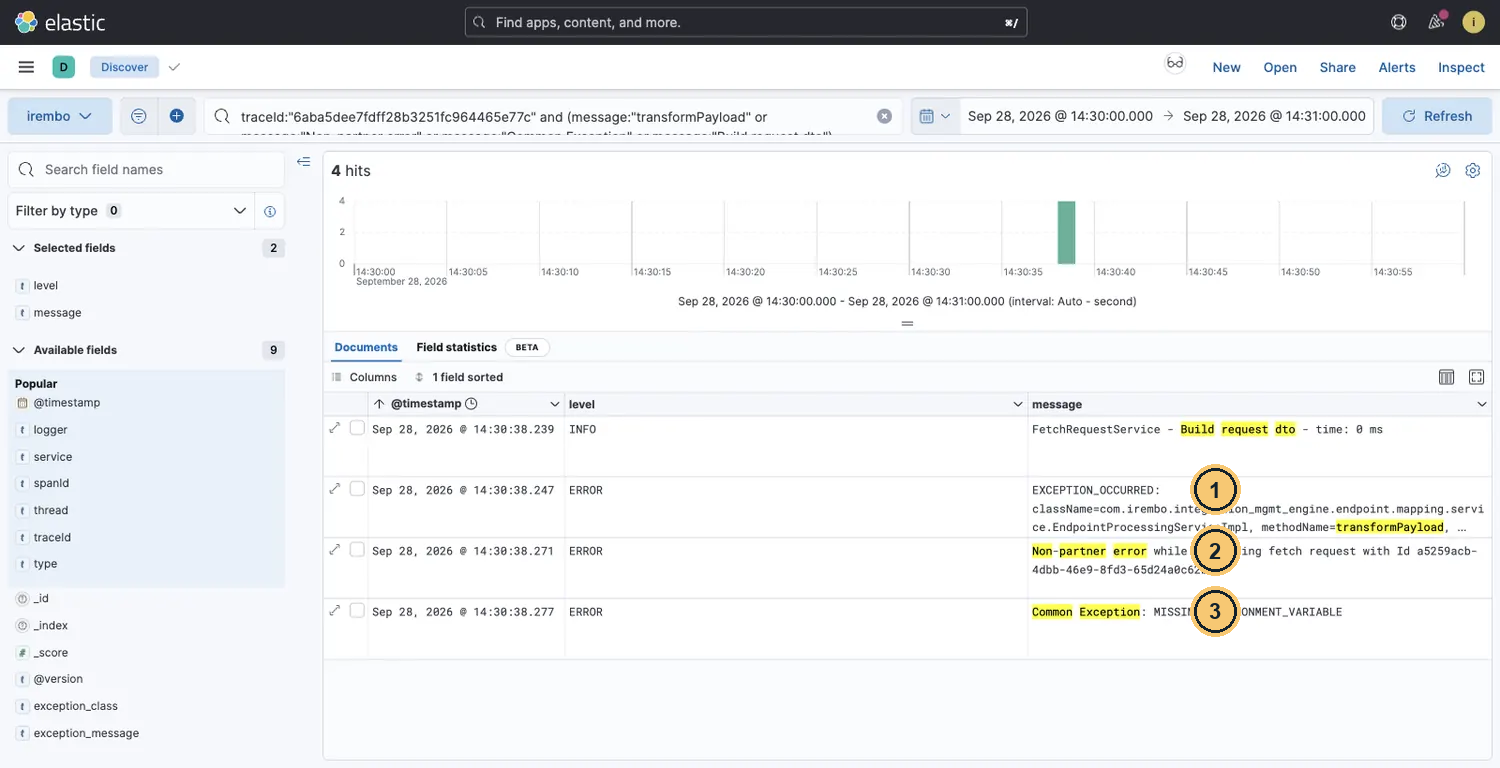
Scenario 2 · missing environment variable: the mapping fails before any HTTP call
- EXCEPTION_OCCURRED in
transformPayload: the request pass of the mapping failed. - Non-partner error with the Request id: KEZA was never called.
- Common Exception: MISSING_ENVIRONMENT_VARIABLE: a
"${NAME}"value is not defined on this environment.
Secrets · fix it the right way
Compare the placeholder name with the name the platform team gave you (it is case-sensitive,
KEZA_PASSWORD≠keza_password), then ask them to define the variable on this environment. Do not “fix” production by pasting the secret into the mapping.
¶ Scenario 3 · a typo in the mapping
We changed "program": programCode to "program": $uppercase(programCod). The mapping saved: JSONata does not know which payload fields exist.
¶ Scenario 3 · the caller’s view · fetch/sync · VICTOR_KEZA_ELIGIBILITY_FETCH
HTTP 500 0.76 s captured on staging · 28 Sep 2026
1 · Request (curl)
curl -s -X POST "https://integration-gateway.staging.iremboinc.com/integration/v1/fetch/sync" \
  -H "Authorization: Bearer $TOKEN" \
  -H "portal: integration-management-portal" \
  -H "Content-Type: application/json" \
  -d '{
  "endpointCode": "VICTOR_KEZA_ELIGIBILITY_FETCH",
  "callerId": "victor-course",
  "requester": "victor-course",
  "payload": {
    "nationalId": "1199880012345678",
    "programCode": "DATA_ANALYTICS"
  }
}' | jq
2 · Real response
{
  "httpStatus": 500,
  "exception": "PartnerException",
  "responseCode": "PARTNER_ERROR_FETCH-VICTOR_KEZA_ELIGIBILITY_FETCH",
  "responseMessage": "{\n  \"found\": false,\n  \"code\": \"LEARNER_NOT_FOUND\",\n  \"message\": \"No learner matches the supplied National ID.\"\n}",
  "fieldErrors": null
}
3 · What to notice
- KEZA answered 404 LEARNER_NOT_FOUND for Aline, who exists. The partner error is real, but the cause is ours.
- The response alone cannot tell you that. The Transformed request line can.
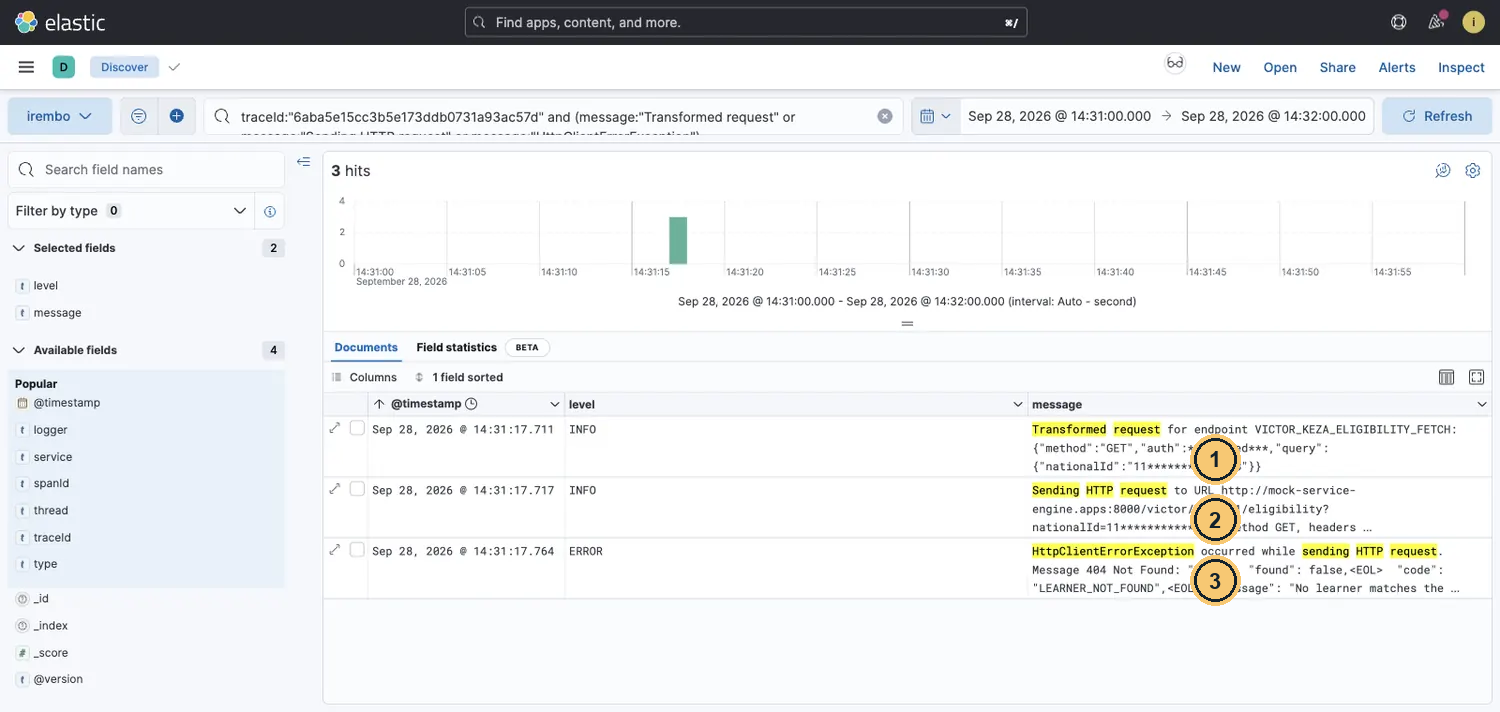
Scenario 3 · mapping typo: the Transformed request is missing a field
- Transformed request: the query has
nationalIdonly, no program.programCodmatched nothing, so JSONata dropped the key. - The URL sent to KEZA has no
&program=. - KEZA answers 404 LEARNER_NOT_FOUND: a misleading partner error caused by our mapping.
Gotcha · Always read the save result
Our first attempt used
$upper(programCode), a function that does not exist. The portal rejected the save with 400, the endpoint kept its previous mapping, and the next test silently ran the old version. After every Update, check for the success message, and searchmessage:"Upserting mapping for endpoint"in Kibana to confirm when the mapping really changed.
¶ Scenario 4 · a wrong password
We set the training password to Keza@2025 (last year’s). The first call still worked: a token was cached under VICTOR_KEZA_TOKEN. To force a login we also changed the storageKey to VICTOR_KEZA_TOKEN_DEBUG.
¶ Scenario 4 · the caller’s view · fetch/sync · VICTOR_KEZA_ELIGIBILITY_FETCH
HTTP 500 0.76 s captured on staging · 28 Sep 2026
1 · Request (curl)
curl -s -X POST "https://integration-gateway.staging.iremboinc.com/integration/v1/fetch/sync" \
  -H "Authorization: Bearer $TOKEN" \
  -H "portal: integration-management-portal" \
  -H "Content-Type: application/json" \
  -d '{
  "endpointCode": "VICTOR_KEZA_ELIGIBILITY_FETCH",
  "callerId": "victor-course",
  "requester": "victor-course",
  "payload": {
    "nationalId": "1199880012345678",
    "programCode": "DATA_ANALYTICS"
  }
}' | jq
2 · Real response
{
  "httpStatus": 500,
  "exception": "PartnerException",
  "responseCode": "PARTNER_ERROR_FETCH-VICTOR_KEZA_ELIGIBILITY_FETCH",
  "responseMessage": "{\n  \"status\": \"FAILED\",\n  \"code\": \"INVALID_CREDENTIALS\",\n  \"message\": \"Username or password is incorrect.\"\n}",
  "fieldErrors": null
}
3 · What to notice
- The partner body says
INVALID_CREDENTIALS: this 401 comes from the login call, not from the eligibility API. - In production this is how a password rotation shows up: calls keep working until the cached token expires, then every call fails.
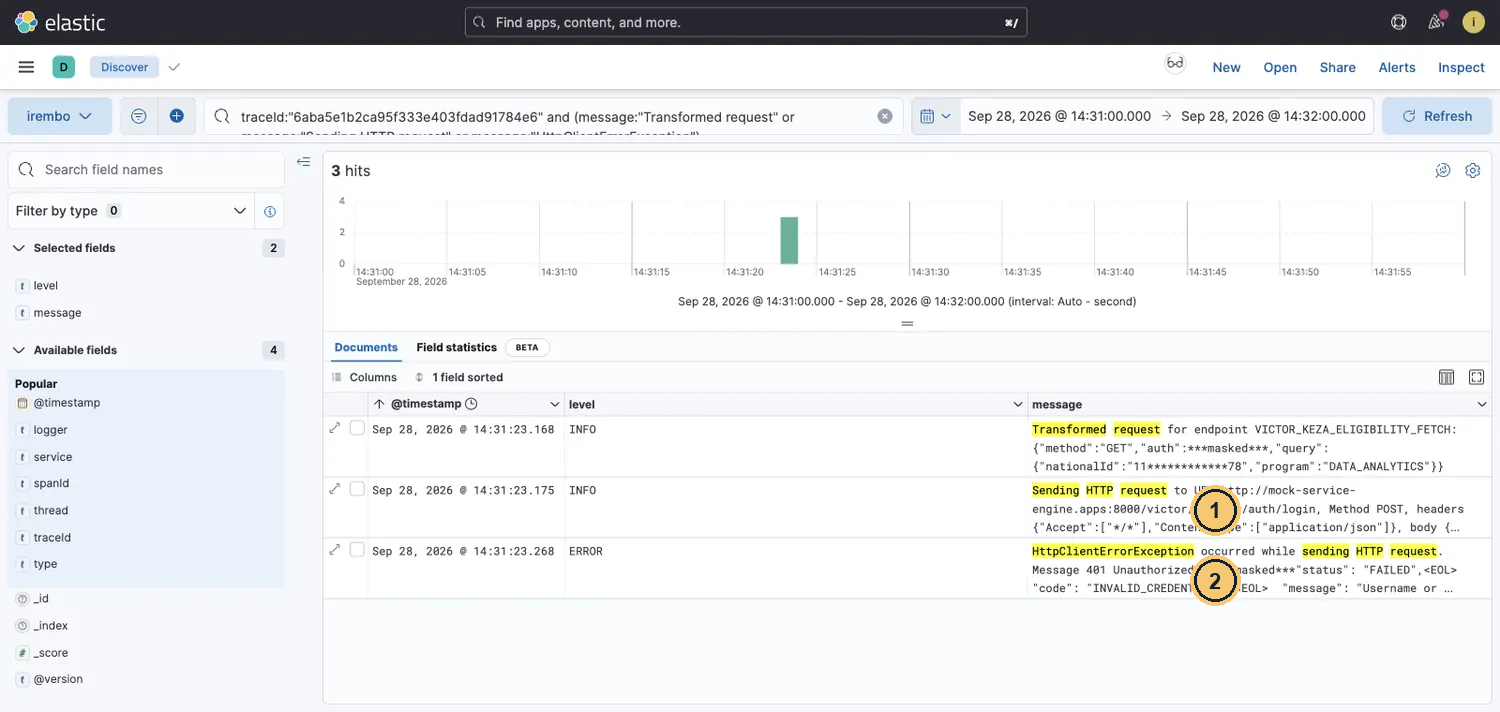
Scenario 4 · wrong password: the login call fails
- Sending HTTP request to
…/auth/login, Method POST: the engine is logging in (no cached token under this storage key). - 401 Unauthorized,
INVALID_CREDENTIALS: the password in the mapping (or in the environment variable) is wrong.
¶ Scenario 5 · a real “not found”
For comparison: the correct mapping, called with the unknown test ID 1190000000000009. The caller sees the same 404 LEARNER_NOT_FOUND as in scenario 3.
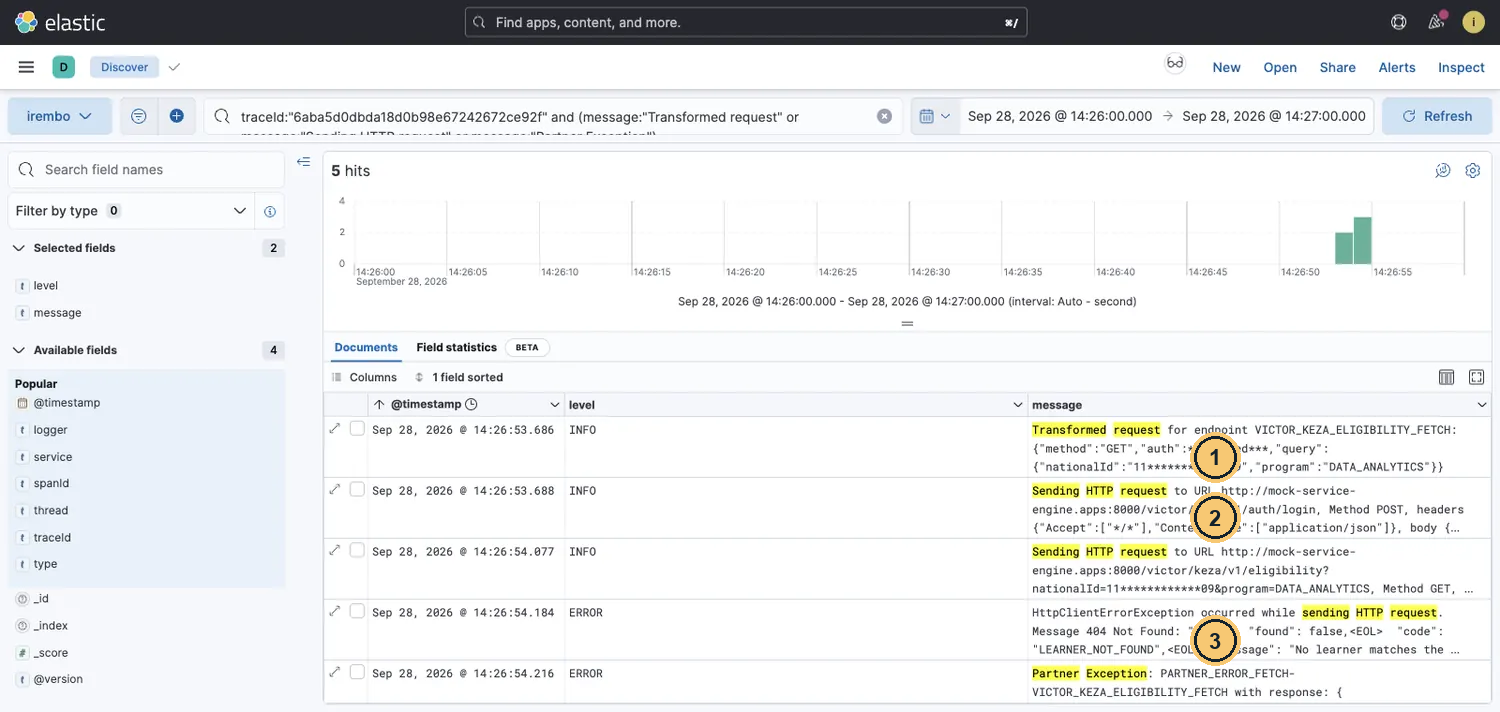
Scenario 5 · a real “not found”: the mapping was right
- Transformed request has both
nationalIdandprogram. - Login, then the eligibility call.
- 404 LEARNER_NOT_FOUND, then Partner Exception: KEZA does not know this learner. A data question for the partner or the applicant.
Symptom → log line → cause
| Caller sees | First line to check in Kibana | If it shows… | Cause |
|---|---|---|---|
| 404 ENDPOINT_NOT_FOUND_EXCEPTION | Get an endpoint by code |
a code that differs from the portal | Caller typo, case, or wrong environment |
| 500 MISSING_ENVIRONMENT_VARIABLE | EXCEPTION_OCCURRED … transformPayload |
no Sending HTTP request after it |
A "${NAME}" not defined here, or a misspelt name |
| 500 PARTNER_ERROR + partner 404 | Transformed request |
a missing or empty field | Mapping typo (scenario 3) |
| 500 PARTNER_ERROR + partner 404 | Transformed request |
every field present and right | Partner data (scenario 5) |
| 500 PARTNER_ERROR + INVALID_CREDENTIALS | Sending HTTP request to …/auth/login |
a 401 right after it | Wrong or rotated password / secret |
| 500 PARTNER_ERROR + UNAUTHORIZED | Sending HTTP request to the partner URL |
no login line before it | Token prefix/header wrong, or a stale cached token |
| 500 “temporarily unavailable” | Sending HTTP request |
no answer, then a timeout or I/O exception | Partner down, slow (60 s), DNS or TLS |
¶ When the traceId does not return everything: Surrounding documents
A traceId:"…" search returns only the lines that carry that traceId. On staging we found lines you may need that do not carry it. Surrounding documents shows the lines logged just before and after one line, whatever their traceId, so you can walk a call step by step.
Why a traceId search can come back incomplete
| Case | Why the traceId search misses it | What to do |
|---|---|---|
| The call was rejected before the engine | The integration gateway logs with an empty traceId (role checks), and a call refused there never reaches the engine | Search service:"integration-api-gateway-engine" in a narrow time range around the call |
| The partner side of a mock call | The mock service (mock-service-engine) logs without a traceId |
Surrounding documents around the engine’s Sending HTTP request line; set the service filter to mock-service-engine and drop the thread filter |
| Automatic retries of a failed push | The scheduler retries on thread scheduling-1, under a new traceId each run (Failed to retry request ID: …) |
Search the Request id (KQL cheat sheet), not the first traceId |
| Your own filtered query | The “keeping only the useful ones” query hides lines on purpose | Open Surrounding documents from any line to see all of them |
| You have only a time and an endpoint code | The caller reported no traceId, so there is nothing to search on | Find the New Relic line by endpoint code in that minute, then walk from there |
¶ Walk one call step by step
We did this on the healthy eligibility call of 28 Sep 2026 (traceId 6aba5e1c…).
¶ Step · 1 · Pick an anchor
In Discover, find one line of the call: by traceId, by Request id, or by endpoint code in a narrow time range. The best anchor is the last normal line or the first error.
¶ Step · 2 · Open Surrounding documents
Click the expand icon (↗) on that row. At the top of Expanded document, click View: Surrounding documents. Note the anchor’s thread value first.
¶ Step · 3 · Add filters
The new page is centred on the anchor (highlighted), but lines from every service and every parallel call are mixed in. Click + (Add filter) and add service is integration-mgmt-engine, then thread is the anchor’s thread. Your Discover search query is not carried over, but Discover filter pills are: remove any traceId pill first, or it hides the very lines you are looking for.
¶ Step · 4 · Load more lines
Type a number in Load … newer documents and Load … older documents and click Load until you see where the call starts (its New Relic transaction named line) and where the next call on that thread starts.
¶ Step · 5 · Read bottom to top
Newest lines are at the top. From the bottom: New Relic → Get an endpoint by code → Transformed request → Sending HTTP request → Got HTTP response or exception → Updating request. Every line between the call’s first line and the next call’s first line on that thread belongs to your call, even with a missing or different traceId.
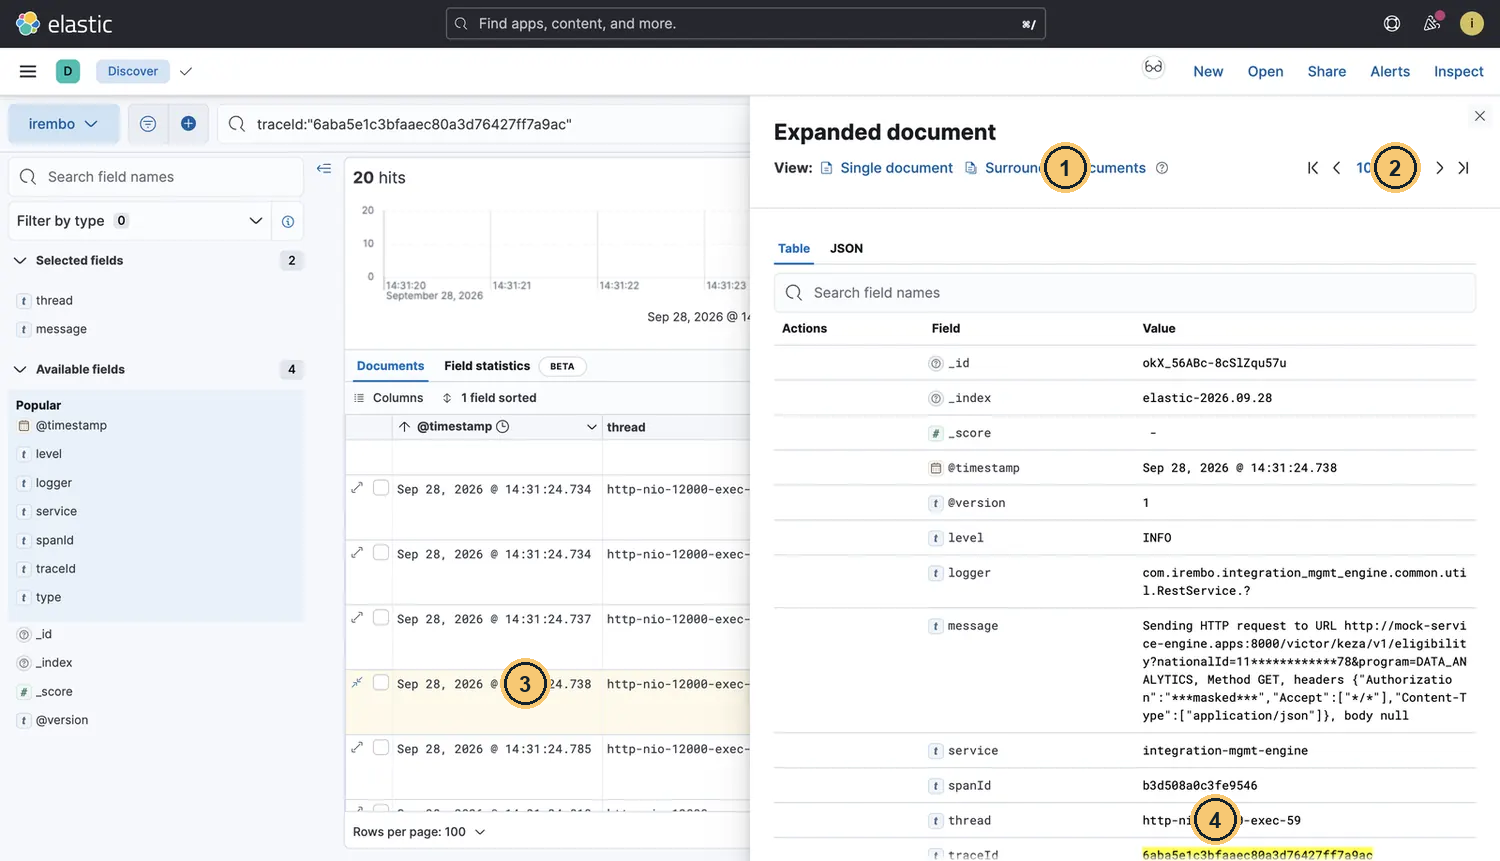
Step 2 · expand the anchor line, then open Surrounding documents
- View: Surrounding documents opens the lines just before and after this one, whatever their traceId.
- Line 10 of 20 in the traceId search: the arrows step through the call line by line.
- The anchor: Sending HTTP request of our eligibility call.
- thread of the anchor (
http-nio-12000-exec-59). A sync call runs on one thread from start to end: you will filter on it.
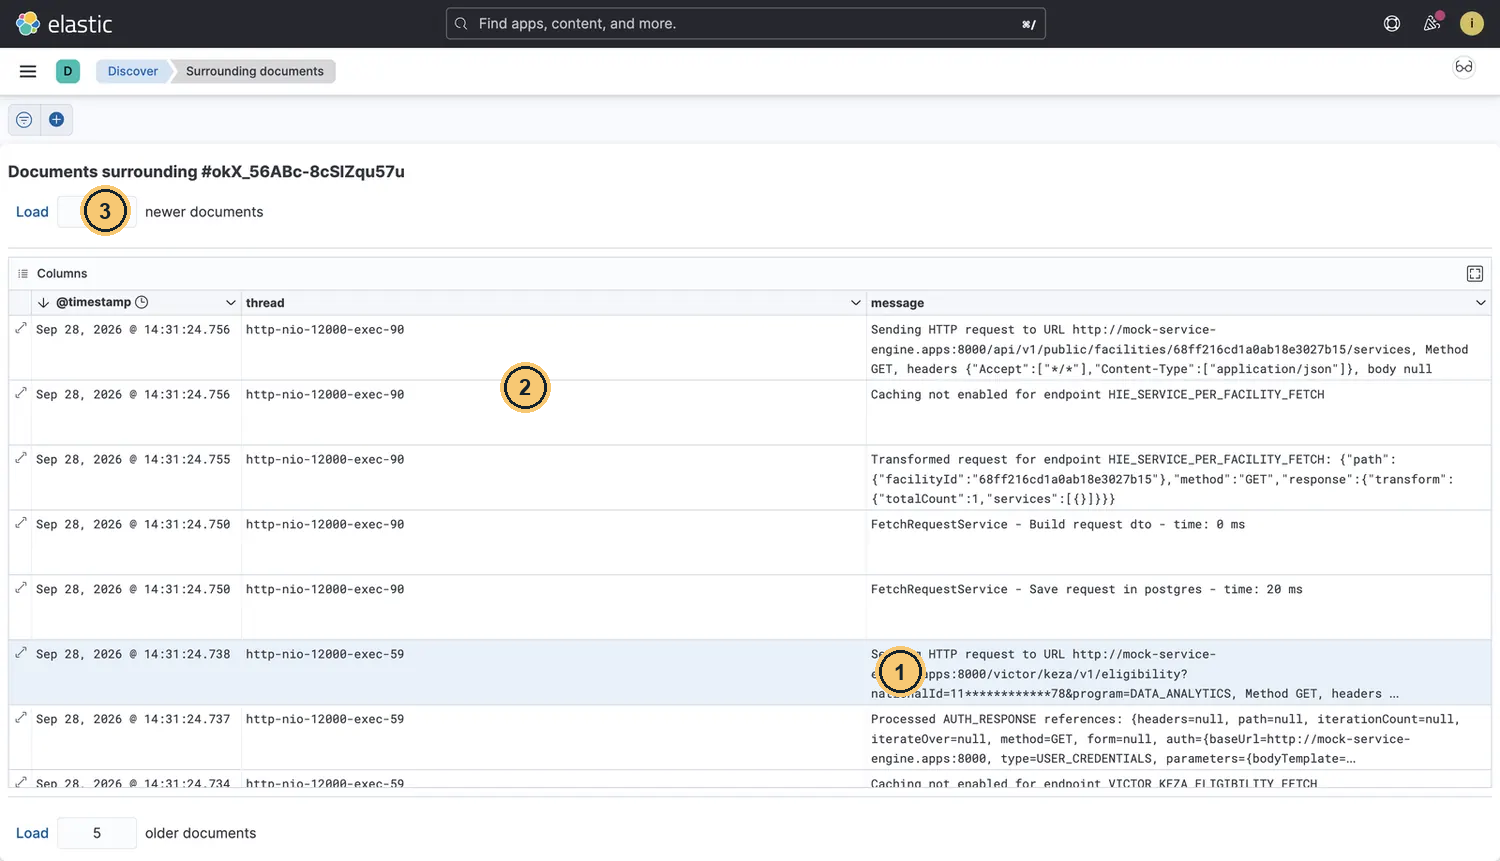
Step 3 · without filters, the lines of parallel calls interleave
- The anchor, highlighted.
- Lines of another team’s endpoint on another thread (exec-90), logged in the same few milliseconds. Not ours: add filters.
- Load … newer documents: newest lines are at the top.
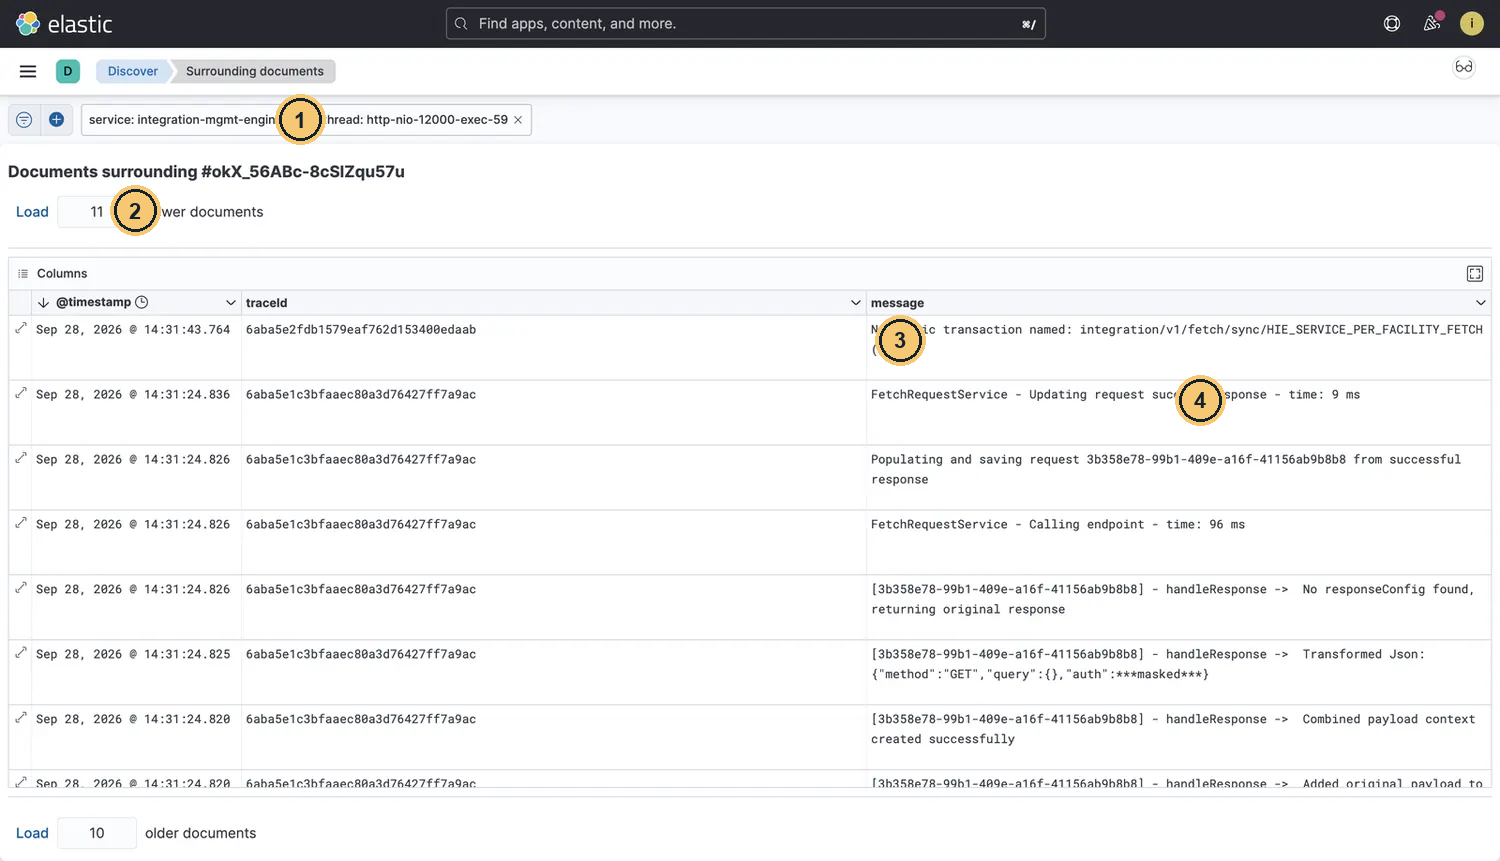
Step 4 · filtered on service and thread: where our call ends
- Filters service and thread (added with + on this page). The search query from Discover is not carried over; its filter pills are.
- How many newer lines to load; type a number, then click Load.
- A new New Relic line with a different traceId, 19 s later: the next call on this thread. Our call ended just below.
- Updating request success response: the last line of our call.
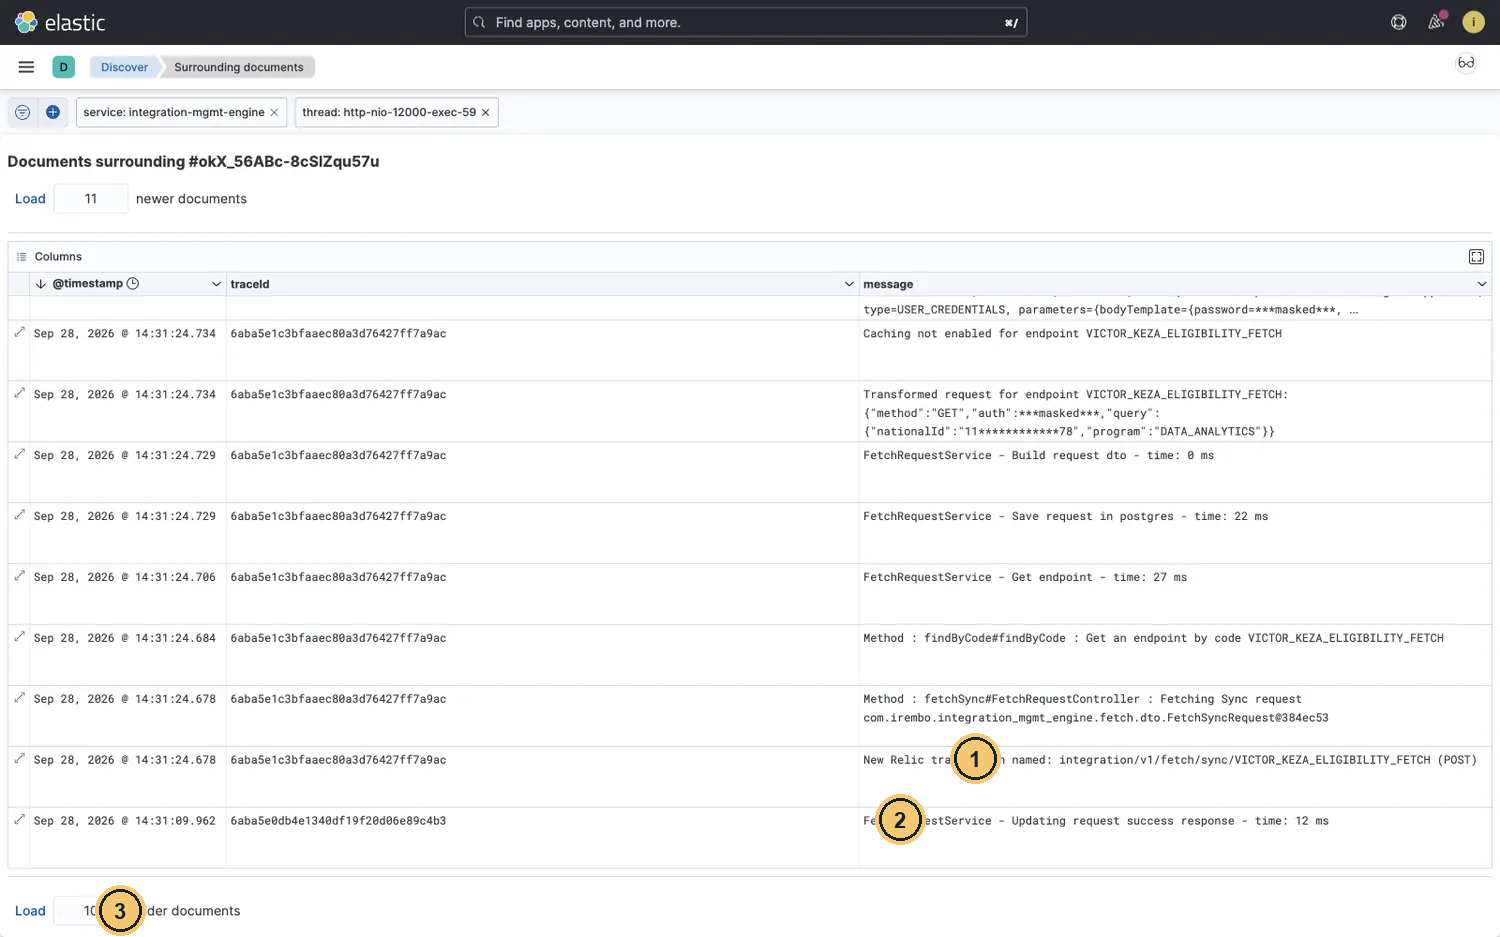
Step 5 · the same view, scrolled down: where our call starts
- New Relic transaction named … VICTOR_KEZA_ELIGIBILITY_FETCH: the first line of our call.
- The line before belongs to the previous call on this thread (other traceId, 15 s earlier).
- Load … older documents until you see where the call starts.
Gotcha · Thread names are reused
A thread serves one call at a time, then the next one:
http-nio-12000-exec-59served another team’s call 15 s before ours and another 19 s after. Only the lines between two New Relic transaction named lines belong to one call. Keep the time range tight, and never copy another team’s lines into your ticket.
¶ Check yourself
You put a wrong password in a USER_CREDENTIALS mapping and save. The next call still returns 200. In Kibana that trace has no …/auth/login line. Why?
- A. The portal did not save the new mapping
- B. KEZA ignores the password on the mock host
- C. A token cached under storageKey was reused
- D. Kibana hides login calls to protect secrets
Show the answer
C. The engine reuses the cached token until expiryBuffer runs out, so it never logged in with the wrong password. Change the storageKey (or wait) to force a login and see the 401.
¶ Check yourself
A call fails with 500 MISSING_ENVIRONMENT_VARIABLE. Which Kibana evidence confirms that KEZA was not called?
- A. No “Sending HTTP request” line in that trace
- B. A Partner Exception line with KEZA’s body
- C. A “Got HTTP response” line with status 500
- D. The New Relic line logged at level ERROR
Show the answer
A. The mapping failed in transformPayload, before any HTTP call, so the trace has no Sending HTTP request line. The New Relic line is logged at ERROR for every call.
Your turn · break your own endpoint, then find it
- On
${YOUR_FIRST_NAME}_KEZA_ELIGIBILITY_FETCH, change the password to the whole-string placeholder"${ALINE_KEZA_PASSWORD}", with your own first name in place of ALINE. No such variable exists on staging. Call it, then find the MISSING_ENVIRONMENT_VARIABLE in Kibana by its Request id.- Put the training password back and misspell one payload path in
query. Save (check the success message), call, and find the Transformed request line with the missing key.- Fix the path, set a wrong password and a new storageKey
${YOUR_FIRST_NAME}_KEZA_TOKEN_DEBUG. Find the login 401 in Kibana.- Restore the original mapping and storageKey and prove a 200. Add the three Kibana screenshots (with their traceIds) to your evidence pack.
- Take the Sending HTTP request line of your 200 call as anchor and open Surrounding documents. Filter on service and thread and load lines until you see the first and last line of your call. Done when: you can name both lines and the traceId of the next call on that thread.
← 6.2 Troubleshooting playbook · 6.4 Endpoint lifecycle, mock switching and safe change →